Skip to content

Overview

GraFx Studio: Figma plugin (experimental)

GraFx Studio icon

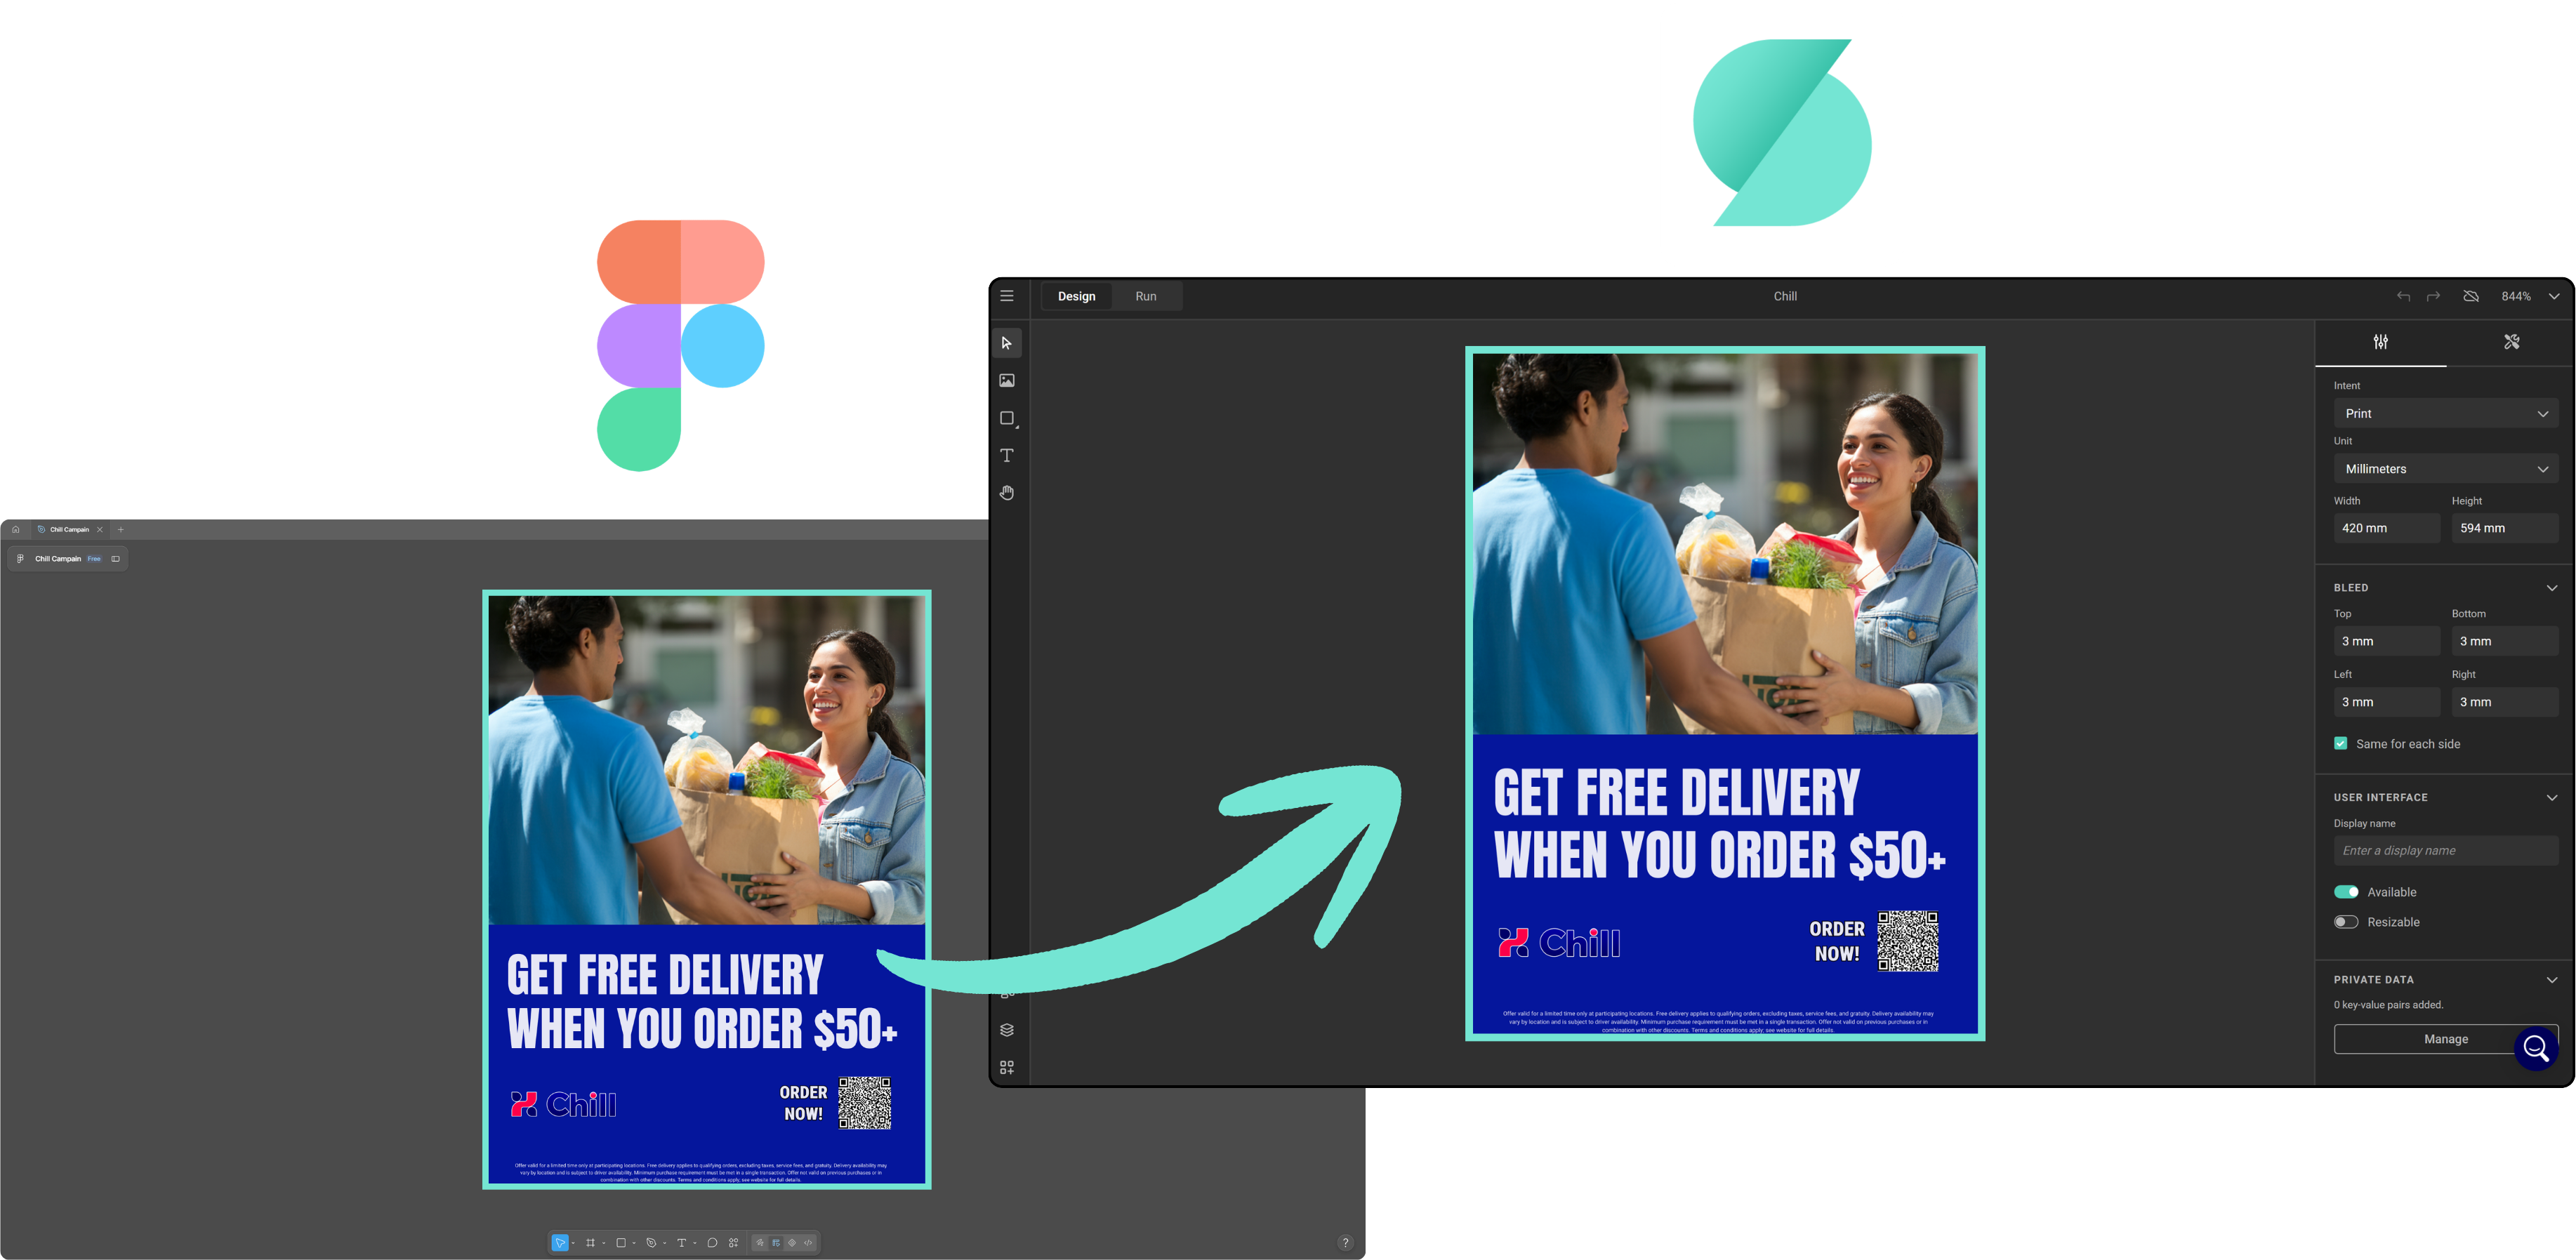
The GraFx Studio Exporter panel open in Figma, showing the selected page and frame, a clean preflight result, and the Export button next to the design being exported

The GraFx Studio Exporter for Figma turns a Figma frame into a GraFx Studio template, joining the existing plugins for Adobe® InDesign® and Adobe® Photoshop®. It runs on Windows and macOS.

✨ New & Improved

  • Text, text styles, and color styles convert to editable GraFx Studio elements
  • Shapes, images, gradients, drop shadows, opacity, and blend modes are supported
  • Preflight reports what GraFx Studio cannot reproduce exactly, before you export

ℹ️ Experimental release

Version 0.8.0 Experimental, available from the plugin downloads page. It is not published on the Figma Community, so you install it yourself. As with anything marked experimental, supported features and behavior can still change between versions.

More info

Read more on the Figma plugin page

Connector CLI v1.14.0 — debugger reliability and UX

GraFx Studio icon

A new version of the Connector CLI improves the reliability and developer experience of the local debugger.

✨ New & Improved

Compile errors in the debugger

When a save introduces a TypeScript error under connector-cli debug, the CLI still logs the diagnostics in the terminal — and now also shows them as a full-page overlay in the debugger. A successful rebuild clears the overlay and reloads the browser tab with the new build.

Until the first successful compile, the connector script is not available in the browser.

Optional browser launch and host binding

The debug server prints the debug URL and does not open a browser by default. Open the reported URL yourself, or pass --open to launch it:

connector-cli debug --open

Bind to a specific host when you need remote access (for example from another device on the network):

connector-cli debug --host 0.0.0.0

Debugger UI and session behavior

The debugger UI is aligned with Platform-style design. Settings and method inputs persist across the session, and copy, empty, and error states are clearer.

ℹ️ Info for existing projects

Node.js 20 is no longer supported. Use a current Node.js LTS — the same contract as Pre-requisites.

More info

Connector CLI v1.13.0 — multi-file connector compilation

GraFx Studio icon

A new version of the Connector CLI adds multi-file TypeScript compilation and expands watch coverage across the connector project.

✨ New & Improved

Multi-file connector projects

You can split connector logic across local .ts modules. The entry point remains connector.ts; the CLI bundles relative imports into a single out/connector.js for publish, test, and debug — the same contract as before.

Allowed imports:

  • Relative / local project .ts files
  • @chili-publish/studio-connectors

Any other npm package is rejected at compile time with an actionable error.

See Project structure for the full layout.

Watch covers all project .ts files

connector-cli build -w and connector-cli debug recompile when any project .ts file changes (not only connector.ts). Under build -w, a failed rebuild logs diagnostics and keeps watching instead of exiting.

ℹ️ Info for existing projects

If you add helper .ts files to an older project that still has:

"include": ["connector.ts"]

widen it so the editor sees the new modules, for example:

{
  "include": ["**/*.ts"],
  "exclude": ["node_modules", "out"]
}

Aligning compilerOptions with a project from connector-cli new (notably moduleResolution: "Bundler" and noEmit: true) is not required for this release — existing projects keep working as they do today without that change. It is still worth doing so your editor/tsc setup matches what the CLI actually uses when it builds. If options differ or tsconfig.json is missing, the CLI falls back to built-in TypeScript settings; with --verbose it reports the skip reason. Matching the scaffold also silences that verbose warning.

New projects from connector-cli new already use the widened include and aligned compilerOptions.

More info

Upcoming Planned Downtime: 14 September 2026

CHILI GraFx icon

On Monday, 14 September, we will be performing infrastructure updates that will require a brief period of server downtime. Please check the table below for when to expect downtime based on the region your GraFx environment(s) are in:

Region Time (UTC) Time (local)
East US 08.00-09.00 14 September, 4.00am-5.00am (EDT)
Australia East 14.00-15.00 15 September, 00.00-01.00 (AEST)
West Europe/UK South/France Central 20.00-21.00 14 September, 22.00-23.00 (CEST)

Finding your environment's region

If you're unsure which physical region any of your GraFx environments are in, you can check this in the "General" section of your environment setting in GraFx. Note that you will need to be set as an Environment Admin to be able to access this page.

If you have questions or need more guidance, please open a ticket at mysupport.chili-publish.com.

CHILI GraFx: Previews no longer counted as renders

CHILI GraFx icon

🐛 What's Fixed

Previews in GraFx Experience no longer inflate your render count

Renders are how CHILI GraFx measures usage against your subscription quota — one render for each output you generate. Previews are not output: they are the images GraFx Experience shows while you set up a project, for example the layout thumbnails you see after selecting layouts for a new project.

Until now, those previews were counted as production renders, which over-reported usage and made render figures harder to reconcile with what was actually produced.

  • Fixed template previews being counted as production renders. GraFx Experience now generates layout and template-page previews through dedicated preview endpoints that fall outside render counting.
  • Fixed preview activity being reported as Image output. Previews were never a downloadable image, so the output-type breakdown in your renders overview now reflects real production only.

Project previews still count

Previews of a project are generated through the regular output routines, using the Output Settings configured in GraFx Experience — so they count as renders like any other output. If you'd rather not have them count towards your quota, configure those Output Settings to apply a watermark. Watermarked output is tracked as its own category and is not billed.

More info

Read more about Renders

CHILI GraFx Environment API: Descriptions for Brand Kit media and colors

CHILI GraFx icon

✨ New & Improved

Describe what each media item and color is for

A name identifies a Brand Kit element, but it does not tell you when to use it. "Logo alt" and "Accent 2" mean something to the person who created them, and little to anyone else who reads the Brand Kit afterwards.

Media and color elements now take an optional description: a free-text string that explains what the element is for.

{
  "media": [
    {
      "name": "Logo",
      "mediaId": "df9c3576-f9ee-4c0e-bfdd-37e2f69da230",
      "description": "Primary logo, for light backgrounds"
    }
  ],
  "colors": [
    {
      "name": "Accent",
      "type": "cmyk",
      "description": "Accent color, reserved for calls to action"
    }
  ]
}

Two things to know:

  • A description belongs to the element, not to the theme. You set it on the default theme, and every theme of the Brand Kit shares it, so "Primary logo" means the same thing on the master brand and on every sub-brand. Editing a description through a non-default theme returns 400 Bad Request.
  • It is optional. Existing Brand Kits keep working unchanged, and elements without a description return none.

The Brand Kit endpoints of the Environment API accept and return descriptions. See Elements for how descriptions fit into a Brand Kit.

What's next

Descriptions give AI-driven features the context that a name alone does not carry, so that GraFx Genie can pick the right media item or color for a given design. That is not available yet.

More info

Read more in the Developer Center

GraFx Studio: Data Source Variables

GraFx Studio icon

✨ New & Improved

A new variable type: Data source

External data used to mean one thing: an Output data source, iterated row by row to produce a batch. That is right for variable data printing, but not for one person making one piece of content.

The new Data source variable type closes that gap. It connects to your data system — a PIM, a CRM, an ERP — and presents it as a table the end user selects a row from. The selected row is preserved, and the template reads its columns like any other variable value.

Selecting a record from a data source variable

Data source variables work only with components

A selected row reaches the design by being mapped to the variables of a component placed in the template. There is no way to feed a data source variable into a text or image frame directly.

Records reach the variable in one of two ways: pulled live from a data connector, or pushed in by an integration at runtime. Connectors must explicitly support this use case, so an existing one may need a small addition first — see Data Connector Fundamentals. The end user browses those records either as a full table or as a simple dropdown.

See Data source variables for the full walkthrough.

Two features, similar names

The batch feature previously called Data source is now consistently called Output data source, everywhere in the UI. It is unchanged. Both work with a table of many rows; the difference is what happens to them — an Output data source iterates through all rows to produce a batch, while a data source variable preserves the one the user selected.

Drive whole components from one record

Component variables can now be mapped straight to the columns of a data source variable, so one record fills an entire component in a single step — a product card taking its name, price, and image from the chosen row. See Use components in a template.

Keep internal component variables out of the mapping list

Variables that exist purely for internal plumbing used to clutter the parent template's mapping list. A new Available for mapping toggle on a component variable controls this. It is on by default, so nothing changes for existing components.

Brand Kit sync, governed centrally

Brand Kit sync keeps a template aligned with its source Brand Kit, but until now every template decided for itself whether that happened automatically.

Environment Settings › General now has a Brand Kit sync settings card with one toggle, Automatically update templates when Brand Kits change. It is on by default, matching how every environment behaves today. Switch it off and newly imported Brand Kits no longer sync automatically, and individual templates cannot opt back in. Manual sync is unaffected either way, and the setting is also available to integrations through the environment settings endpoint.

🔧 Improvements

Smart Crop

  • Snapping when centering the POI. Dragging the Point of Interest toward the middle of the Subject Area now snaps to it, with dotted guides shown only when aligned. See Set the Subject Area & POI.
  • Previews update while you drag, in both GraFx Studio and GraFx Media, instead of only on release.
  • A cleaner properties panel. The Subject type dropdown on an image frame is hidden when the environment defines no subject types beyond Default. See Select a Subject type.

Editor and text

  • Component resize mode is inheritable. A layout override is marked in the usual warning color and resets like any other property. Default is Scale.
  • Faster editor loading. The editor no longer waits for every font to load; unused fonts are fetched on demand. Output is unchanged.
  • Superscript and subscript follow the font. As announced in July, they use each font's own size and offset rather than a fixed style, so appearance may change.
  • No forced break between variables. Adjacent variables in a text frame no longer create a guaranteed line-wrap point in view mode.
  • A signal when the end user finishes editing a frame. In project mode, the SDK emits an event once a frame has been resized, rotated, cropped, or its text changed, after any triggered actions resolve.

🐛 Bug Fixes

  • Colors and Brand Kits. The picker no longer shows the wrong state after switching a color from CMYK to RGB or HEX. Theme colors edited in a template sync back correctly, the sync flag no longer reports a sync that never happened, and Smart Crop data refreshes when a theme change swaps a frame's asset.
  • Text frames. The loading indicator is shown again while content loads. Allow inline text editing no longer redraws the frame with an overridden maximum height, which could shift layouts combining copyfitting and auto-grow.
  • Components and actions. A component whose variable rules fail no longer crashes; default resize mode is correct again; action loops are reliably detected; resetting a layout animation override returns its duration.
  • Output. Strokes on image frames are visible in PDF output, and an invalid image is reported as an in-flight error for its record instead of failing the whole job.
  • Interface. The animation reset block design is corrected.

More info

CHILI GraFx Environment API: Sign out of a connector connection

CHILI GraFx icon

✨ New & Improved

Sign out of a connector connection

Connectors that use OAuth 2.0 Authorization Code authorize each user individually: the first time you open a template that reads from such a connector, you sign in to the external system yourself, and CHILI GraFx keeps that authorization session for you. Until now that session could not be cleared — the only way to start over was to delete and republish the Connector, which affected every user of it.

A new endpoint ends the calling user's own authorization session for a Connector:

POST /api/v1/environment/{environment}/connectors/{connectorId}/auth/oauth-authorization-code/logout

The next time that user accesses the Connector, the sign-in flow runs again. This is useful when you need to connect as a different account in the external system, or when a session no longer works and you want to re-authorize cleanly.

Two things to know:

  • It only affects the user making the call. The session is resolved from the access token, so other users of the same Connector keep their own sessions. There is no way to sign out on someone else's behalf.
  • It requires a user token. Any user with access to the environment can call it. Integration (machine-to-machine) tokens are rejected, because OAuth 2.0 Authorization Code sessions belong to a person rather than to an integration.

See Authorization for Connectors for the details, and how OAuth 2.0 Authorization Code fits into the wider connector authorization model.

More info

Read more in the Developer Center

Connector CLI v1.12.1

GraFx Studio icon

A new version of the Connector CLI — the command-line tool used to develop, configure, and manage CHILI GraFx connectors — is available. This release is about the local debugger, and about closing the gap between how a connector behaves on your machine and how it behaves once published.

✨ New & Improved

Execution metrics for every method invocation

When you invoke a connector method in the debugger, most of what matters happens out of sight: how long the method took, and which external requests it made along the way. Until now the debugger showed only the end result, so a slow query or an unexpected extra round-trip was hard to spot.

The debugger now shows an Execution metrics panel alongside the output. For every method you invoke, it reports whether the call succeeded or failed, how long it took to complete, and a record of every outgoing fetch — including the URL and the time each one took. If a method made no external calls, the panel says so explicitly, which is a quick way to confirm a caching or short-circuit path is working as intended.

Two smaller changes to the result panel: errors are now visually distinct from successful responses, and the formatted JSON output can be copied to your clipboard in one click.

Pasted asset IDs are cleaned up automatically

Testing a method that takes an asset ID — such as detail or download — usually means running query first and copying an ID out of the result. Because that result is rendered as JSON, the value you copy tends to arrive with its surrounding quotes or braces attached, and the method then fails on characters that were never part of the ID.

Fields in the debugger that expect an ID now normalize what you paste, extracting the ID itself and discarding the JSON around it.

Watch mode is always on

The debugger recompiles connector.ts whenever you save it and reloads the browser tab. This is no longer something you opt into — watch mode is always active when you run connector-cli debug, so the edit-and-refresh loop works without any extra flags.

Compilation problems are also reported more consistently, so a TypeScript error is raised as an error instead of leaving you debugging an out-of-date build.

🔧 Improvements

sleep() now works in the debugger

Connectors that need to pace themselves — polling an external job until it completes, or backing off after a rate-limit response — use the global sleep(ms) helper to pause between requests. That helper was available in the connector runtime but not in the local debugger, so any connector using await sleep(...) failed under connector-cli debug even though it ran correctly once published.

The debugger now provides sleep(ms) as well, bringing it in line with the runtime. Polling and back-off logic can be tested locally instead of only after deployment.

More info

GraFx Studio: Convert RGB Colors to CMYK in PDF Output

GraFx Studio icon

✨ New & Improved

Convert RGB colors to CMYK in PDF output

Comparison of the sRGB and CMYK color gamuts on a CIE 1931 xy chromaticity diagram

Image: CIE1931xy gamut comparison, Wikimedia Commons, CC BY-SA

PDF output settings now support converting RGB colors to CMYK during export. Templates often contain RGB content — photos from a DAM, or colors defined for screen — and this new option brings that content into your print-ready color space, as a complementary step to the CMYK conversion:

  • Enable it in your PDF output setting — switch on Convert RGB colors to CMYK colors in the Color management section. The switch becomes available once the intended and target CMYK profiles are set, since RGB colors convert to the same target CMYK profile — see the PDF output settings guide.
  • Pick an RGB source profile — RGB colors with an embedded profile are converted using that profile; for unmanaged RGB colors, choose the assumed source profile (such as sRGB IEC61966-2.1 or Adobe RGB (1998)) from the dropdown that appears.

For Environment API integrations, postProcessing.colorTransformation accepts two new properties: convertRGBColors (optional, default false) and intendedRGBIccProfile (required when convertRGBColors is true):

{
  "postProcessing": {
    "colorTransformation": {
      "intendedIccProfile": "ISO Coated v2 (ECI)",
      "destinationIccProfile": "Coated GRACoL 2006 (ISO 12647-2:2004)",
      "convertRGBColors": true,
      "intendedRGBIccProfile": "sRGB IEC61966-2.1"
    }
  }
}

More info