Renders
A render is a measurement for the usage on the CHILI GraFx platform.
Local vs Server
A lot of calculation is done on the client side, or local.
E.g. movement of frames, showing the animation, etc...
Output
To generate output, server routines are necessary.
When these routines are called, a render is counted. Depending on the type of output, more or less renders are counted towards the average.
This average is used to size your allowance in your subscription.
Examples
Static Digital Output
1 render is counted for each Static Digital Image output generation
Animated Digital Output
Basic concept: 1 render is counted towards each (started) second of output.
CHILI GraFx looks at the length of the animation. Not at the output framerate or whether or not only part of the clip or the whole clip is animated.
Note
Some examples
- An animation with a duration of 0.1 seconds: 1 render
- An animation with a duration of 0.5 seconds: 1 render
- An animation with a duration of 1.5 seconds: 2 render
- An animation with a duration of 2 seconds: 2 renders
- An animation with a duration of 2,5 seconds: 3 renders
- An animation with a duration of 3 seconds: 3 renders
Watermarked output does not count as a render. Watermarked renders are tracked separately and shown as their own category in the dashboard, at both environment and subscription level.
AI-generated image output (GraFx Genie)
Images generated through GraFx Labs — for example via the GraFx Genie Product Image Creator or Product Image Composer — are counted as Static Digital Output renders.
1 render is counted per generated image.
Note
GraFx Labs is only available in Production environments.
Static PDF output
1 render is counted towards each PDF file.
Static PDF output with variable data (datasource)
When variable output is used, this is the formula to count renders.
The first 50 renders are counted individually, then each subsequent set of 10 add 1 render1.
Formula
V = Variable Data source size (e.g. 1000 records)
Renders = 50 + (V-50)/10
In this case: 50 + (1000-50)/10 = 50 + 95 = 145
The output task is what counts, not the number of files
The formula is applied per output task, based on the number of records in that task. How the result is delivered makes no difference: whether the task produces one PDF containing all records or several PDF files each containing a part of them, the render count is identical.
Splitting a single task across several files is a deliberate option, set through the Output API in your integration. The maxRecordsPerFile property defines how many records end up in each PDF file:
The task still counts as one, whatever value you use.
Info
maxRecordsPerFile is available via the API only. There is no equivalent setting in the GraFx Studio interface.
Note
Same task, same renders
A task with 100 records: 50 + (100-50)/10 = 55 renders
- 1 PDF with 100 records: 55 renders
- 4 PDFs of 25 records, from that same task (
"maxRecordsPerFile": 25): 55 renders
Splitting those 100 records over 4 separate output tasks of 25 records is a different story. Each task is then counted on its own: 4 × 25 = 100 renders, because none of them passes the first 50 records where the discount starts.
Previews
Previews are the images shown while you work — for example the layout thumbnails GraFx Experience displays when you select layouts for a new project. A preview is not an output you can download, so it does not count as a render.
Previews of a project are the exception. These are generated through the regular output routines, using the Output Settings configured in GraFx Experience, and count as renders like any other output.
Tip
If you'd rather not have project previews count towards your quota, configure the Output Settings used for them to apply a watermark. Watermarked output is tracked separately and does not count as a render.
Fair use policy
In your subscription, you're entitled to a render quota.
Your dashboard will show the actual status of renders for the full subscription (all environments, with a delay of ±1 day).
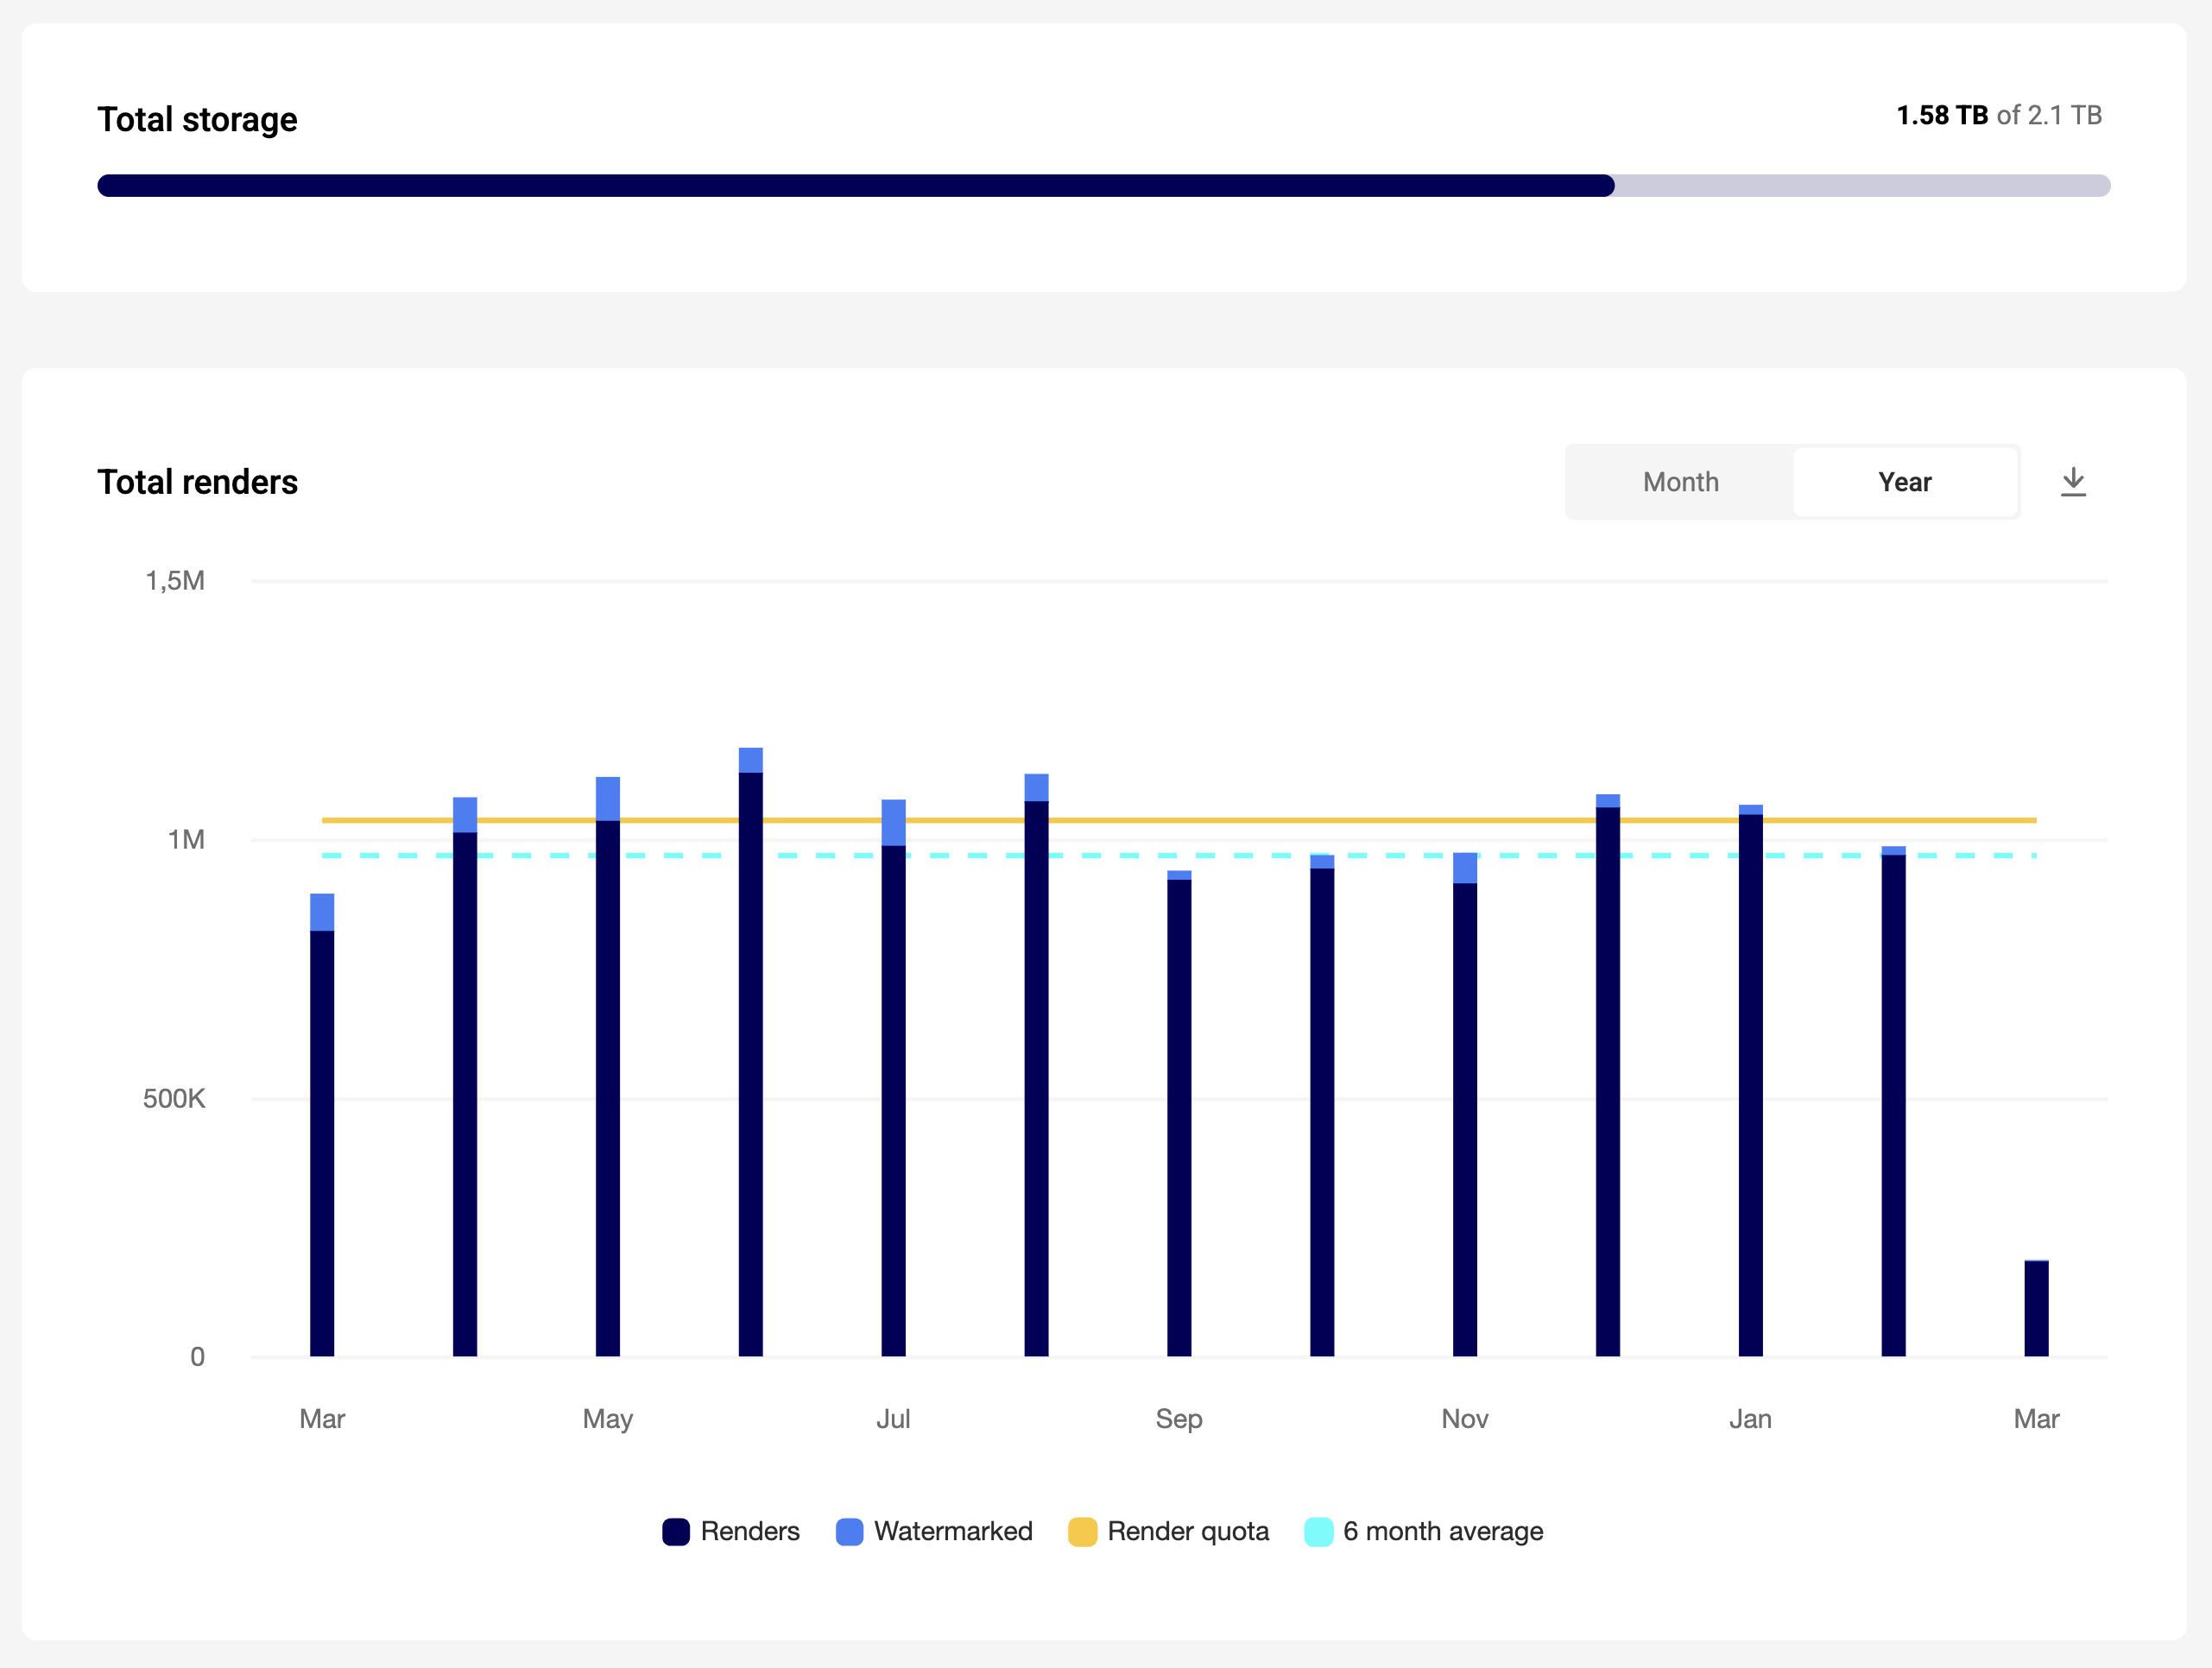
The light blue line shows the "rolling average".
Rolling average
Depending on your contract, the rolling average calculation might differ in amount of months taken into the calculation.
When you select an environment, you'll see the details.
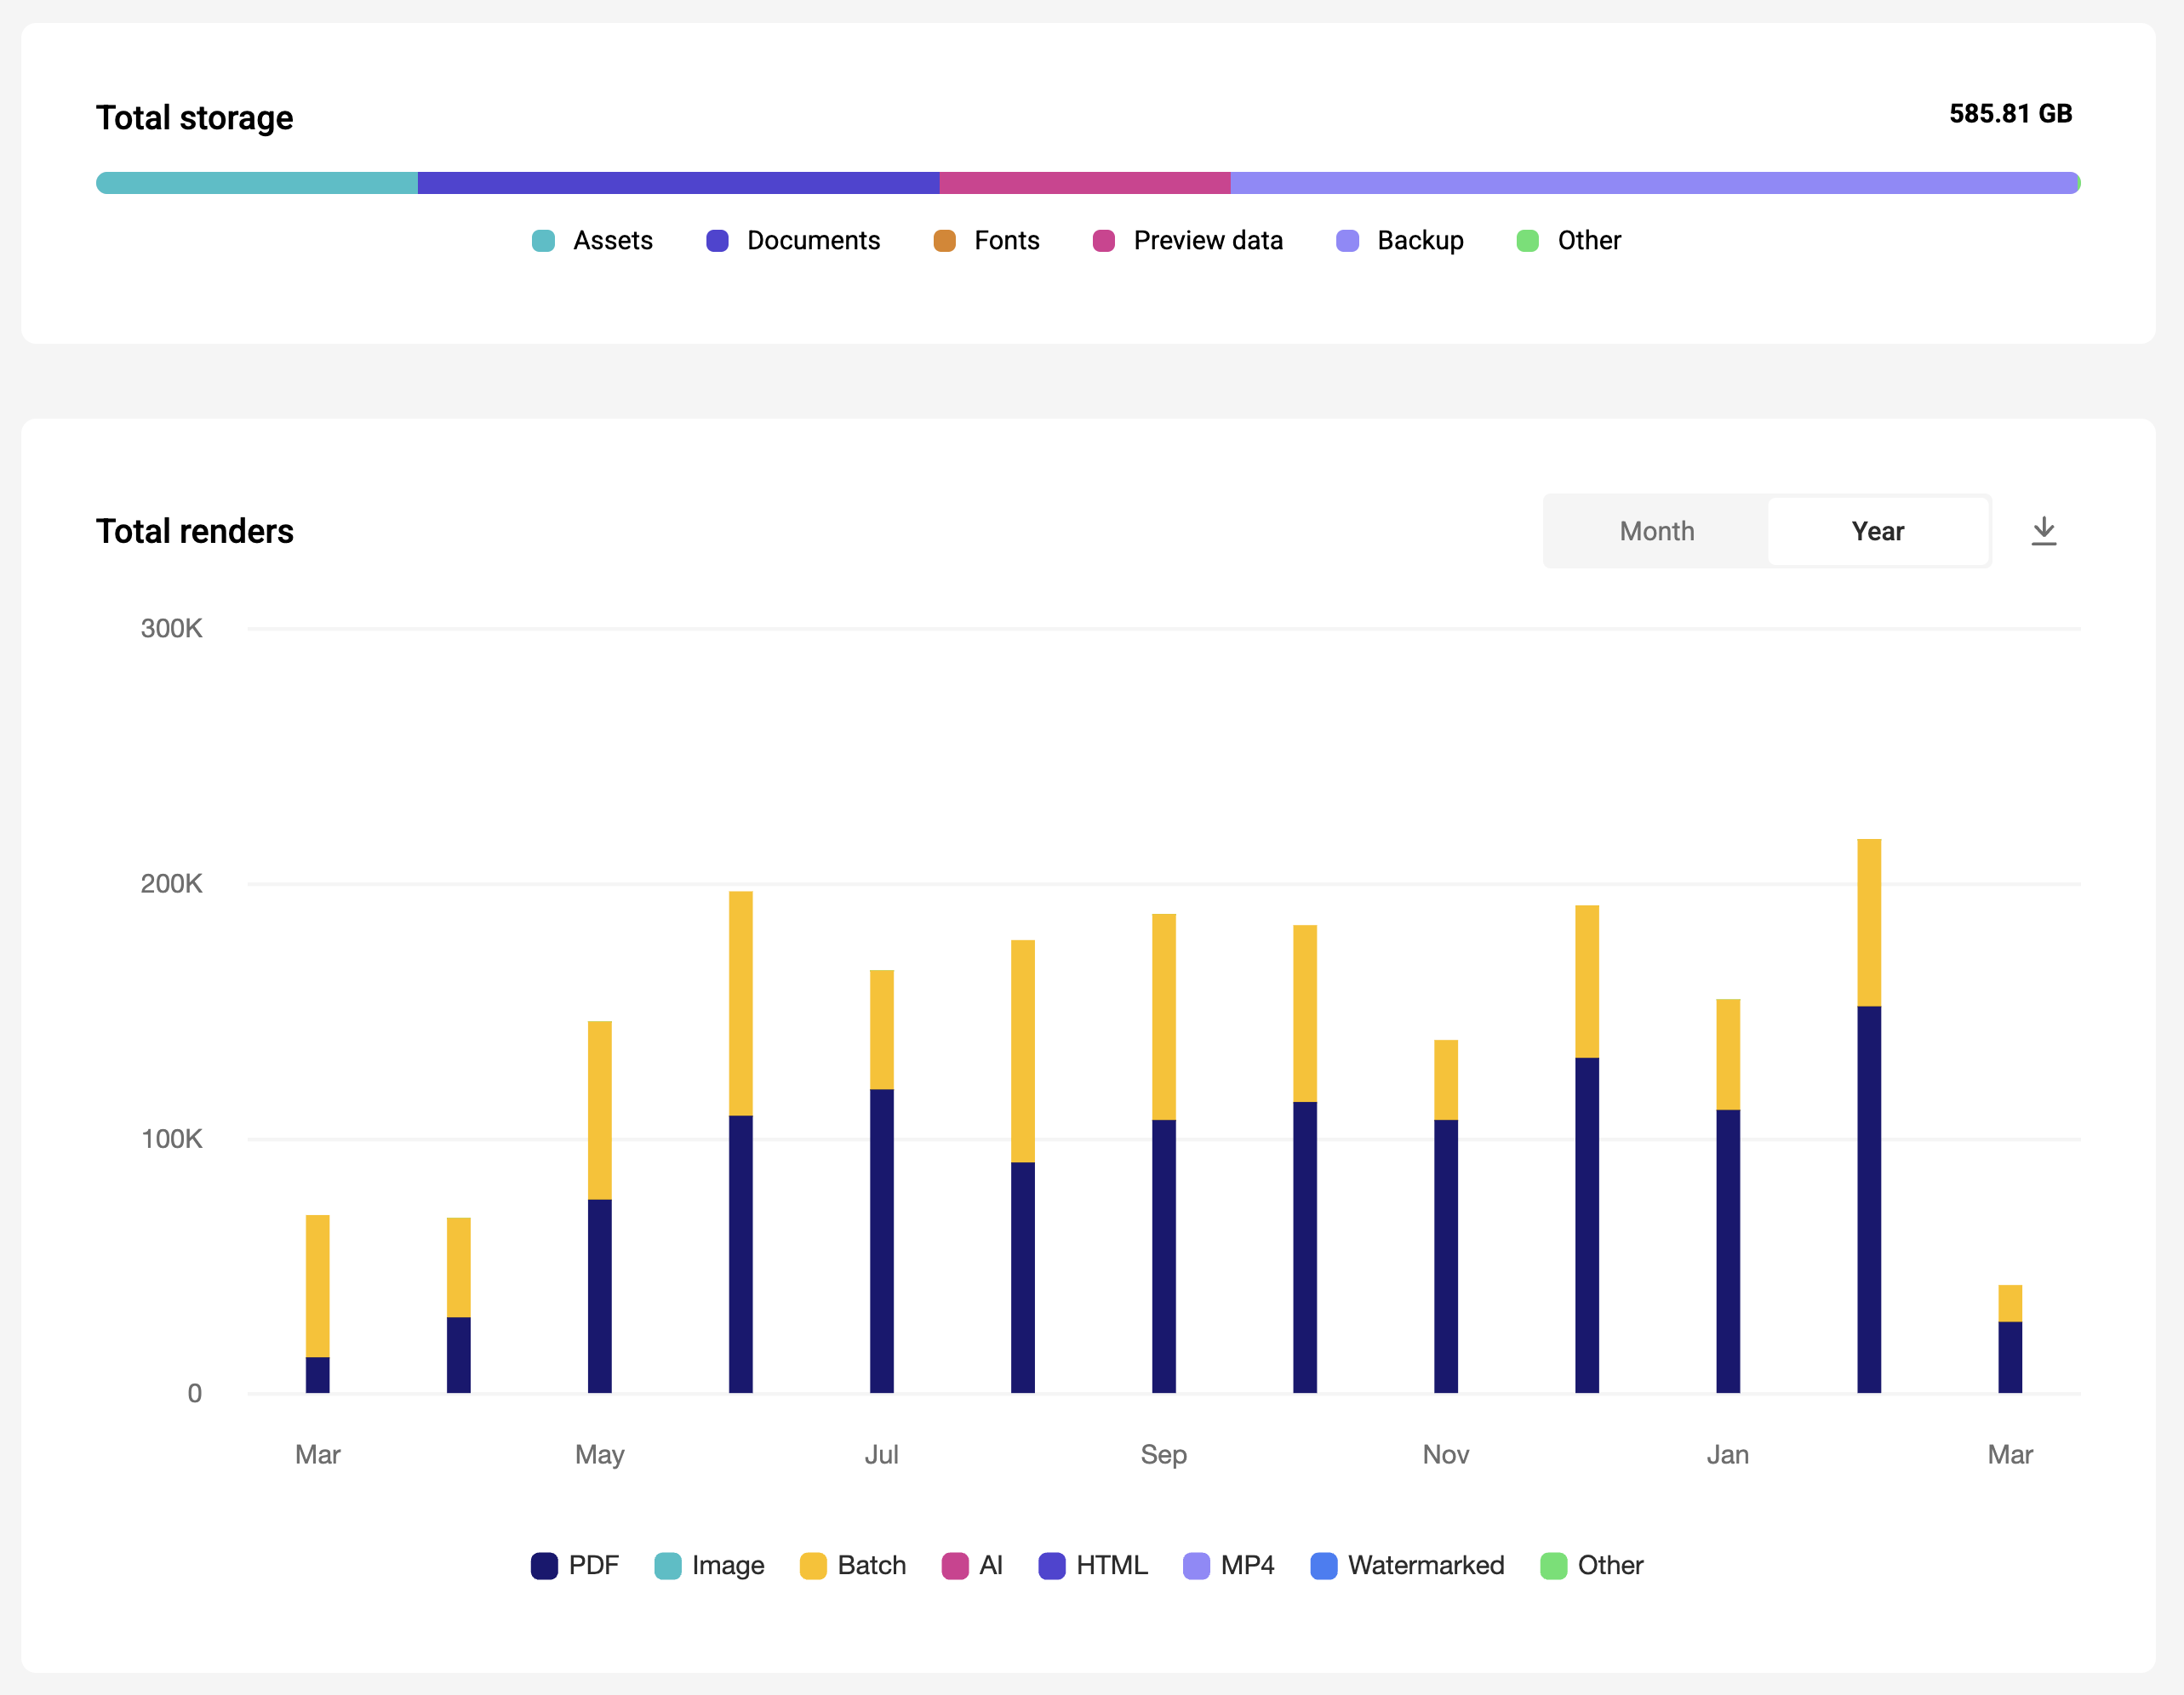
Render quota are not a hard limit per month. If you generate more output than the render quota, we won’t block or watermark the output.
When the rolling average exceeds the render quota, you will be invoiced an extra render pack to increase your render quota to at least the average.
Frequently Asked
How do you calculate my usage?
We take your contractual rolling average and compare to quota.
The average is calculated over a rolling window of days rather than calendar months, so it doesn't shift with the length of the month. The window moves every day: one day drops off the back as today is added at the front.
Average
E.g. 6 months rolling average calculation: Total of past 183 days divided by 6
E.g. 3 months rolling average calculation: Total of past 91 days divided by 3
The Platform API reports both your average and the number of days it was calculated over:
The averageRendersPeriodDays property returns the averaging period that applies to your subscription.
What if I need a temporary burst?
There is no hard limit, so you can always burst to much higher than your quota.
If the rolling average remains below the contract, nothing will change.
When the rolling average exceeds the render quota, you will be invoiced an extra render pack to increase your render quota to at least the average.
-
1/10 is the default. Depending on your contract, the number might be different. ↩